API description
The current package includes a series of functions to perform cronobiology analysis.
The package itself has 4 files:
chrono_plotter.py: contains functions to plot data
chrono_reader.py: contains functions to read data
chrono_rythms.py: contains functions to fit cosinor models
chrono_simulation.py: contains functions to create simulated data
Note
You can find more information about the usage of each function at the documentation of each file in the introductory tutorial section under the user guide
Chrono Reader
The chrono_reader module provides functionalities for reading data from various sources and preparing it for analysis and visualization within the CircadiPy package. It offers the following features:
Data Source Support: The module is capable of reading data from multiple sources, including the ER4000 receiver, the Intellicage system, and generic
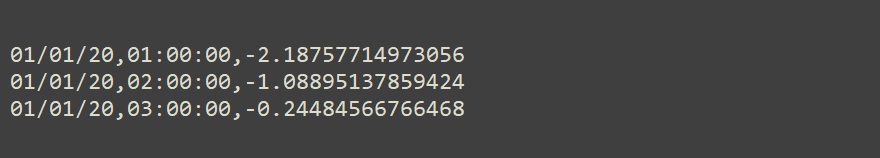
.ascfiles, provided they adhere to specific formatting patterns for each source.Data source support Date
Time
Value
01/01/20
01:00:00
-2.18757714973056
01/01/20
02:00:00
-1.08895137859424
01/01/20
03:00:00
-0.244845667664682
If you have a data table like the one above, transform it to the following pattern:
dd/mm/yy,HH:MM:SS,VV.VV
The asc file should end up looking like this (This is the start of the file)
warning
Protocol Object Creation: Upon reading and processing the data, the module generates a protocol object that encapsulates relevant information necessary for subsequent analysis and plotting tasks.
Workflow Optimization Functions: The module offers utility functions that enhance the workflow when working with the protocol object. One example is a method for concatenating data from multiple experiments seamlessly.
Data Exploration Assistance: The module includes methods designed to facilitate data exploration. These methods are particularly useful when experimenters need to extract data from specific time intervals of interest.
Filtering Capabilities: A built-in method allows the application of filtering techniques such as the Savitzky-Golay filter and moving average filter to the data.
Normalization Methods: The module provides a method to normalize the data using either a z-score transformation or the min-max scaling approach.
The chrono_reader module acts as an essential foundation for data input, preprocessing, and initial exploration within the CircadiPy package.
Chrono Rhythm
The chrono_rhythm module plays a pivotal role in CircadiPy by providing tools for analyzing cyclic or periodic patterns commonly encountered in chronobiology analysis. This module offers the following key features:
Cosinor Regression: The package incorporates the cosinor regression, also known as the cosinor method, to detect and analyze cyclic patterns within time-series data. This method involves fitting a cosinor model to the focused data, enabling the characterization of rhythmic behaviors.
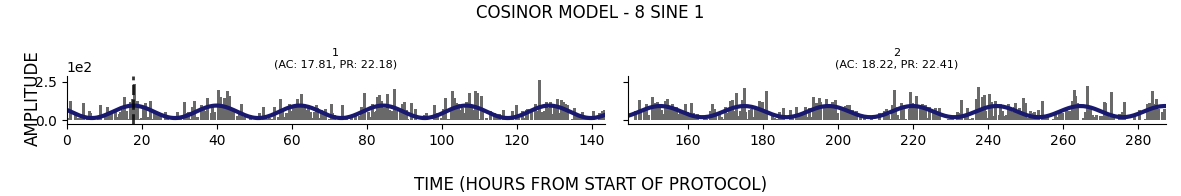
Cosinor regression example
Daily Activity Sum: The module includes a function dedicated to calculating the total activity per day for the given experiment, allowing researchers to gain insights into the overall daily activity patterns.
Enhanced Cosinor Handling: To streamline the cosinor fitting process, the module provides convenient methods that facilitate the application of cosinor fitting on a daily basis.
Significance-based Analysis: Aligning with the core objective of the package, the module offers functions designed to ensure that only the most significant results are utilized in the analysis and fitting processes. This enhances the accuracy of the findings.
The chrono_rhythm module enables the detection, analysis, and leveraging of cyclic patterns present in the data, ultimately contributing to a more insightful and refined analysis process.
Chrono Simulation
The chrono_simulation module serves as the primary script for generating simulated data within the CircadiPy package. This module offers the following functionalities:
- Protocol Simulation: Within this module, users can create simulated protocols, which are objects used in subsequent analyses. The simulation process encompasses various parameters, including:
Sampling Frequency: Users can define the sampling frequency for the simulated data, such as intervals of 30 minutes.
Signal Types: The module supports the simulation of different signal types, such as sine waves or square waves.
Noise Profile: Users can specify the noise profile to emulate realistic experimental conditions.
Signal-to-Noise Ratio (SNR): The module allows users to set the signal-to-noise ratio in decibels (dB), influencing the fidelity of the simulated data.
The chrono_simulation module creates syntetic data accordingly to the protocol onbject mentioned in the Chrono reader section.
This synthetic data can be valuable for testing, validation, and exploring different analytical approaches within the package.
Chrono Plotter
The chrono_plotter module serves as the central script for visualizing data, offering a range of valuable visualization tools within the CircadiPy package.
The module leverages the same protocol object used in previous instances for streamlined visualization
This module provides the following features:
Time Series Visualization: It offers the capability to generate time series visualizations of the protocol data, enabling users to observe trends and patterns over time.
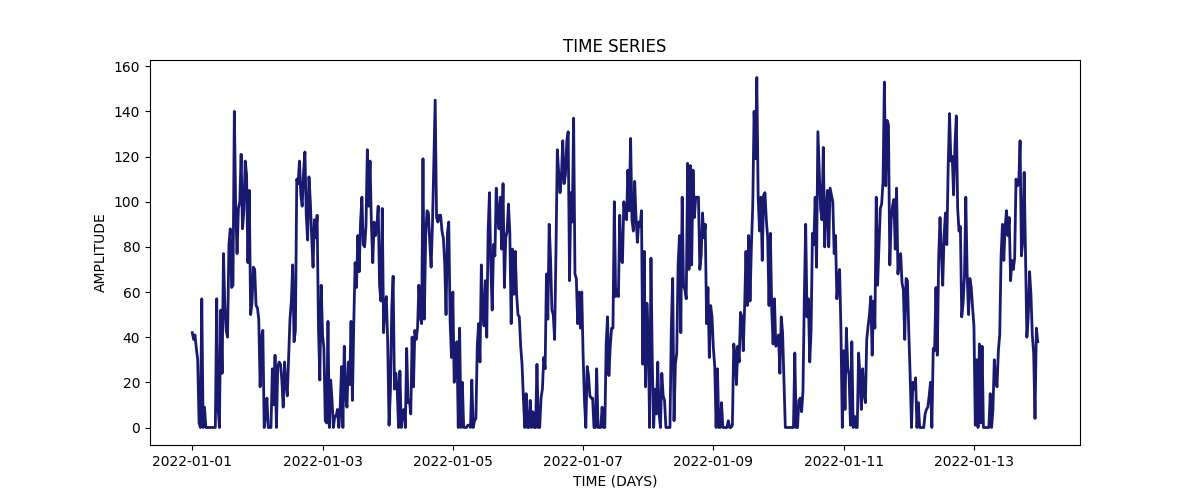
Time series example
- Actogram Plotting: The module includes functions for generating actogram plots using bar plots. These actograms visualize activity patterns and circadian rhythms present within the protocol.

Actogram example
- Colormap Actograms: Users can create actogram plots using colormaps, enhancing the visual representation of activity-rest cycles.

Actogram example
Periodogram Plotting: The module supports periodogram plotting, providing insights into frequency components and potential rhythmic patterns present within the data.
Cosinor Analysis Visualization: It offers functions to visualize the results of cosinor analysis. This includes plotting the cosinor period and acrophase for each day of the protocol. These visualizations are based on the results of the
fit_cosinor_fixed_periodfunction, with acrophase and other parameters calculated while fixing the period to each stage.Cosinor Model Comparison: The module enables the comparison of the cosinor model with the protocol data for each stage. This visualization aids in assessing how well the cosinor model fits the actual signal.
Cosinor Model Period and Acrophase Plotting: Users can visualize the cosinor model’s period and acrophase for each stage of the protocol.
The chrono_plotter module provides the tools to create create comprehensive visualization outputs, enabling the exploration, analysis, and comparison of various temporal patterns within their data.